Oblok
Self-hosted Developer Operations Platform for service monitoring, log aggregation, queue tracking, and incident management.
Role Solo Developer
Architecture Monolithic MVC
Infrastructure VPS Linux
Commits 105+
The Challenge
Engineering teams rely on a fragmented stack of SaaS tools for monitoring, logs, deployments, and queues — causing high costs, fragmented operational data, and increased context-switching during incidents.
The Approach & Solution
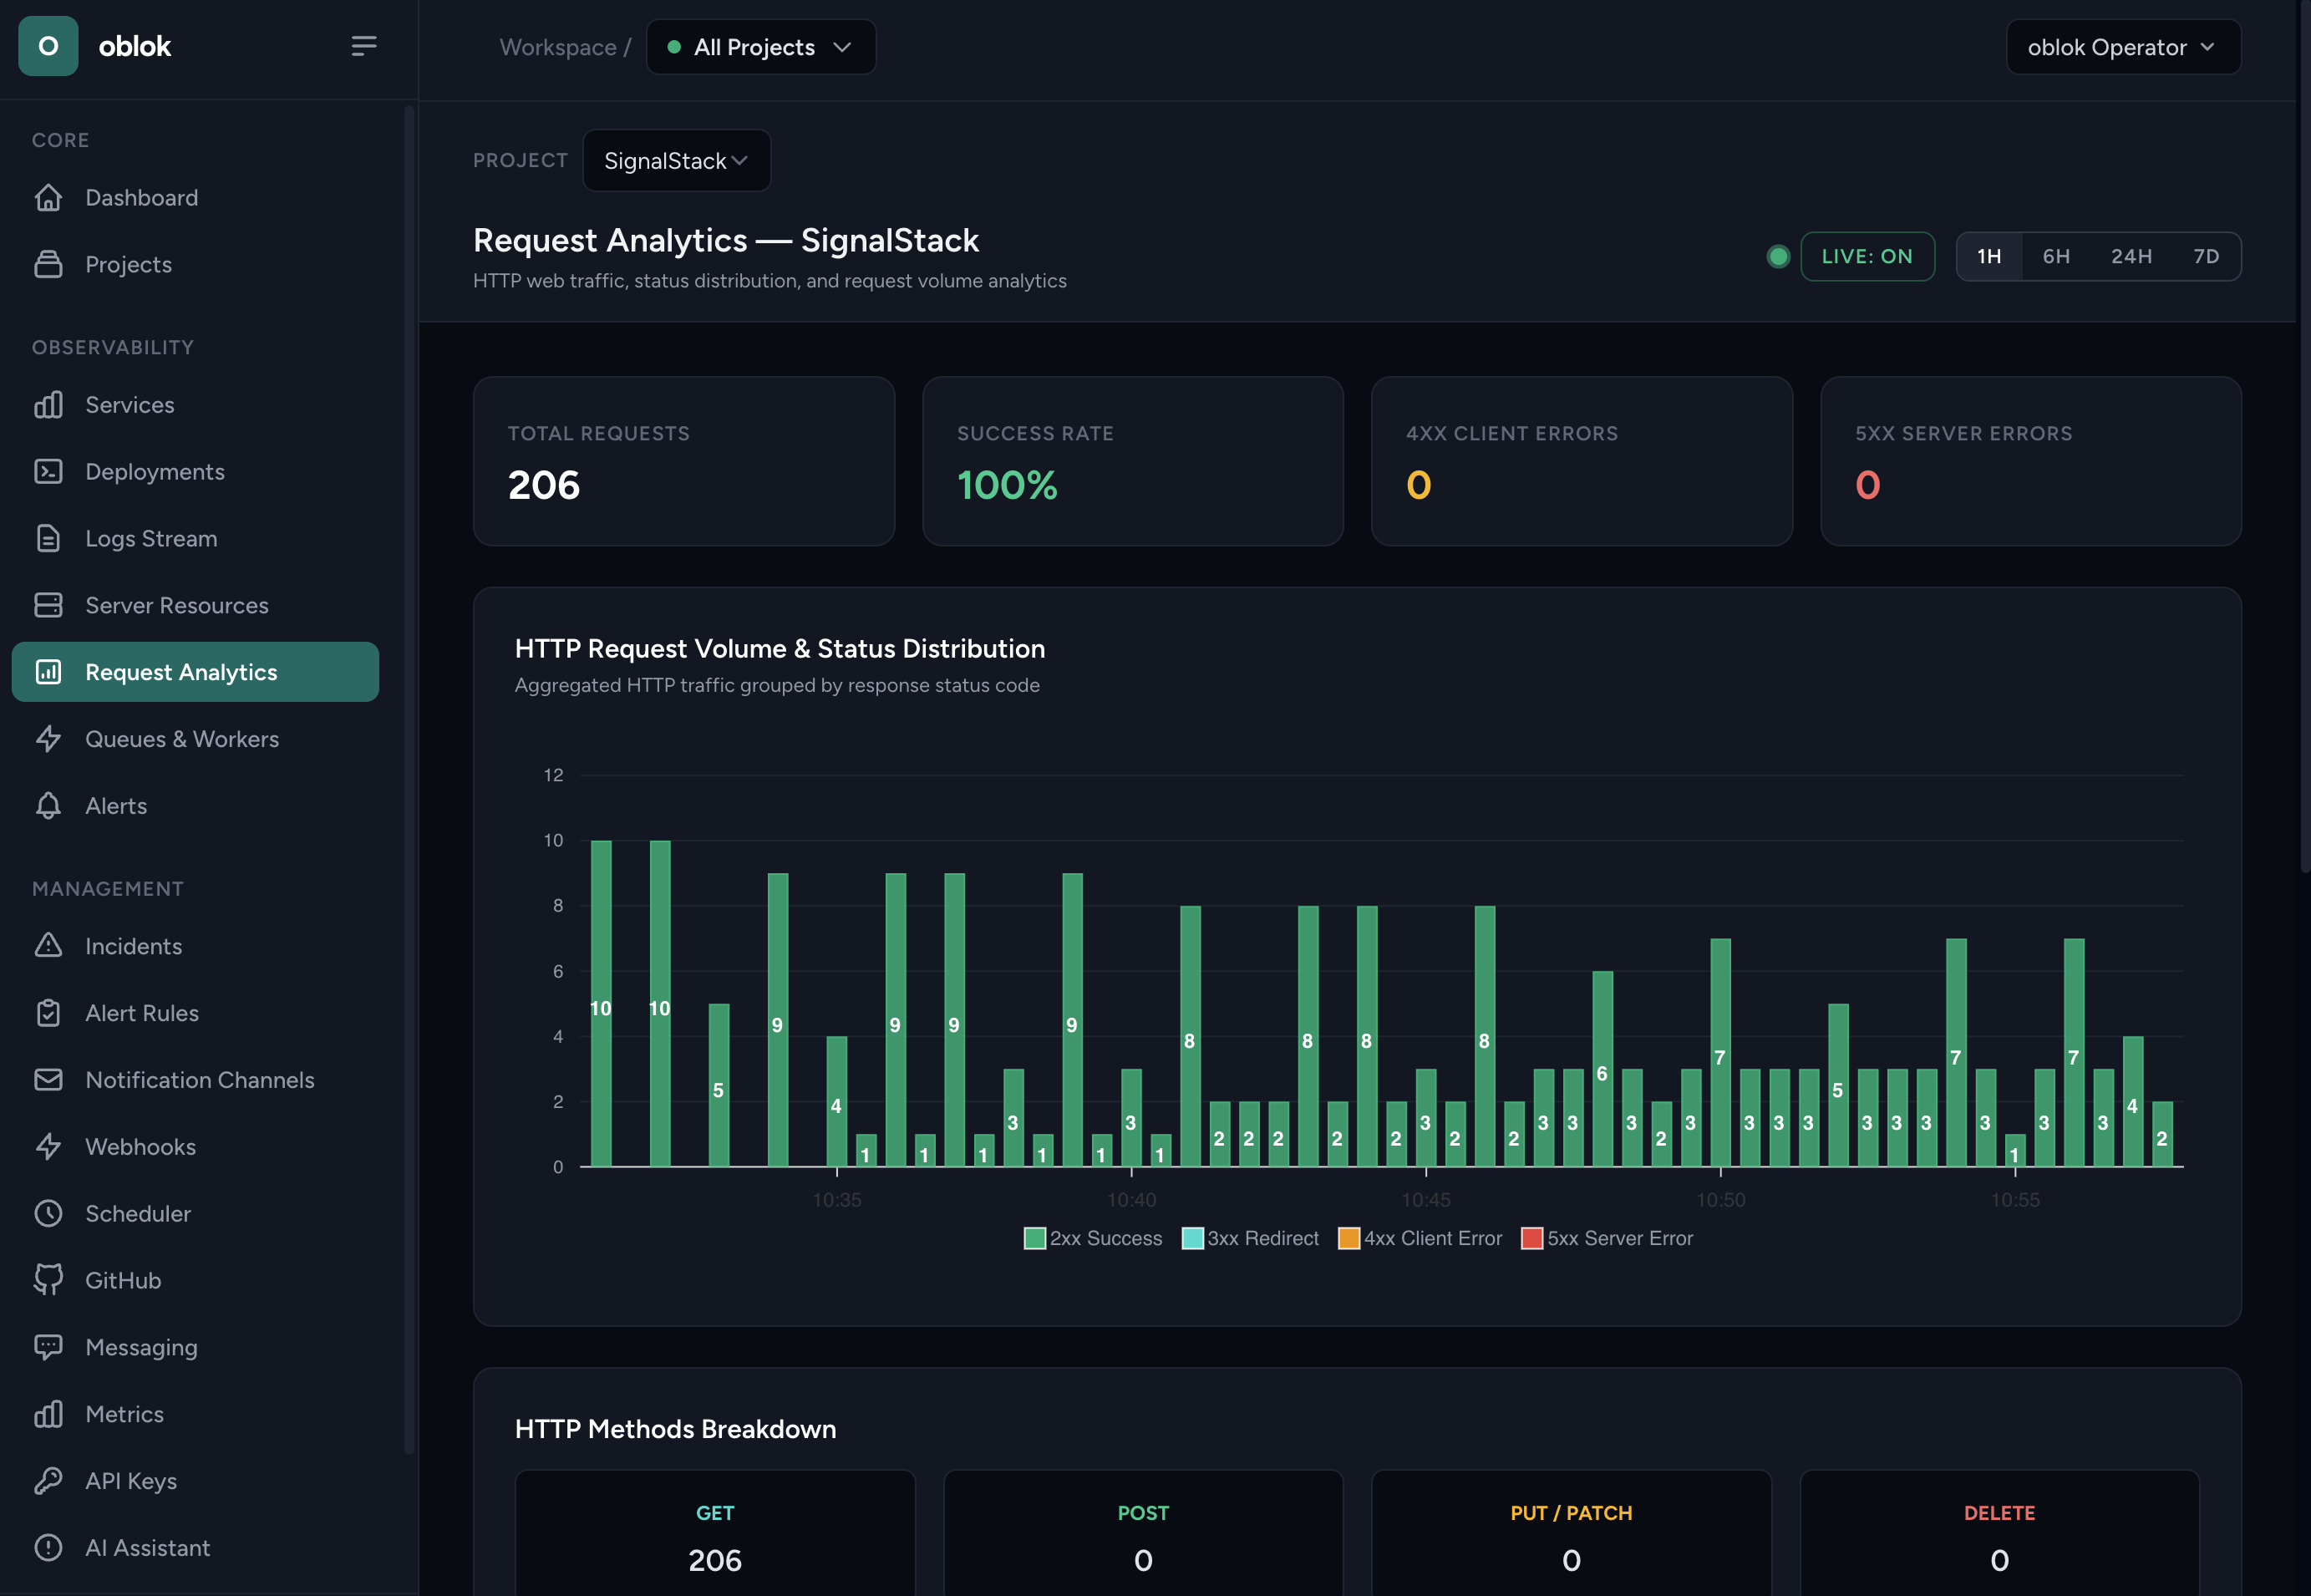
A unified, self-hosted Developer Operations platform providing real-time HTTP service monitoring, WebSocket-powered log streaming, Horizon/Redis queue inspection, deployment webhook tracking, and alerting under a single control plane.
Technologies Used
Engineering Highlights
- Built a multi-protocol service health monitor that checks HTTP endpoints, tracks uptime percentages, and streams sub-second response times with real-time ApexCharts visualizations.
- Created an ingestion API and log shipper framework (oblok-agent) for real-time log aggregation with level filtering and instant live stream updates via WebSockets.
- Integrated a queue control plane providing Horizon/Redis queue visibility, job processing latency graphs, and automatic incident generation on job failures.
- Streamlined incident response by combining deployment hooks, cron scheduler monitoring, and custom alert rules with Slack/Webhook dispatch channels.